深度学习-TextDetection

本文主要对常用的文本检测模型算法进行总结及分析,有的模型笔者切实run过,有的是通过论文及相关代码的分析,如有错误,请不吝指正。

一下进行各个模型的详细解析

CTPN 详解

代码链接:https://github.com/xiaofengShi/CHINESE-OCR

CTPN是目前应用非常广泛的印刷体文本检测模型算法。

CTPN由fasterrcnn改进而来,可以看下二者的异同

网络结构 FasterRcnn CTPN
basenet Vgg16 ,Vgg19,resnet Vgg16,也可以使用其他CNN结构
RPN预测 basenet的predict layer使用CNN生成 basenet之后使用双向RNN使用FC生成
ROI 模型适用于目标检测,为多分类任务,包含ROI及类别损失和BOX回归 文本提取为二分类任务,不包含ROI及类别损失,只在RPN层计算目标损失及BOX回归
Anchor 一共9种anchor尺寸,3比例,3尺寸 固定anchor宽度,高度为10种
batch 每次只能训练一个样本 每次只能训练一个样本

根据ctpn的网络设计,可以看到看到ctpn一般使用预训练的vggnet,并且只用来检测水平文本,一般可以用来进行标准格式印刷体的检测,在目标框回归预测时,加上回归框的角度信息,就可以用来检测旋转文本,比如EAST模型。

代码分析

网络模型

直接看CTPN的网络代码

1
2
3
4
5
6
7
8
9
10
11
12
13
14
15
16
17
18
19
20
21
22
23
24
25
26
27
28
29
30
31
32
33
34
35
36
37
38
39
40
41
42
43
44
45
46
47
48
49
50
51
52
53
54
55
56
57
58
59
60
61
62
63
64
65
66
67
68
69
70
71
72
73
74
75
76
77
78
79
80
81
82
83
84
85
86
87
88
89
90
91
92
93
class VGGnet_train(Network):
# 继承自NetWork,关与NetWork可以看这里:https://github.com/xiaofengShi/CHINESE-OCR/blob/master/ctpn/lib/networks/network.py
def __init__(self, trainable=True):
self.inputs = []
self.data = tf.placeholder(tf.float32, shape=[None, None, None, 3], name='data')
self.im_info = tf.placeholder(tf.float32, shape=[None, 3], name='im_info')
self.gt_boxes = tf.placeholder(tf.float32, shape=[None, 5], name='gt_boxes')
self.gt_ishard = tf.placeholder(tf.int32, shape=[None], name='gt_ishard')
self.dontcare_areas = tf.placeholder(tf.float32, shape=[None, 4], name='dontcare_areas')
self.keep_prob = tf.placeholder(tf.float32)
self.layers = dict({'data': self.data, 'im_info': self.im_info, 'gt_boxes': self.gt_boxes,'gt_ishard': self.gt_ishard, 'dontcare_areas': self.dontcare_areas})
self.trainable = trainable
self.setup()

def setup(self):
# 对于文本提议来说,类别为2,一类为为文字部分,另一类为背景
n_classes = cfg.NCLASSES
# anchor的初始尺寸,论文中使用的是16
anchor_scales = cfg.ANCHOR_SCALES
_feat_stride = [16, ]

# base net is vgg16
# 内部使用的函数
(self.feed('data')
.conv(3, 3, 64, 1, 1, name='conv1_1')
.conv(3, 3, 64, 1, 1, name='conv1_2')
.max_pool(2, 2, 2, 2, padding='VALID', name='pool1')
.conv(3, 3, 128, 1, 1, name='conv2_1')
.conv(3, 3, 128, 1, 1, name='conv2_2')
.max_pool(2, 2, 2, 2, padding='VALID', name='pool2')
.conv(3, 3, 256, 1, 1, name='conv3_1')
.conv(3, 3, 256, 1, 1, name='conv3_2')
.conv(3, 3, 256, 1, 1, name='conv3_3')
.max_pool(2, 2, 2, 2, padding='VALID', name='pool3')
.conv(3, 3, 512, 1, 1, name='conv4_1')
.conv(3, 3, 512, 1, 1, name='conv4_2')
.conv(3, 3, 512, 1, 1, name='conv4_3')
.max_pool(2, 2, 2, 2, padding='VALID', name='pool4')
.conv(3, 3, 512, 1, 1, name='conv5_1')
.conv(3, 3, 512, 1, 1, name='conv5_2')
.conv(3, 3, 512, 1, 1, name='conv5_3'))
# RPN
# 该层对上层的feature map进行卷积,生成512通道的的feature map
(self.feed('conv5_3').conv(3, 3, 512, 1, 1, name='rpn_conv/3x3'))
# 卷积最后一层的的feature_map尺寸为batch*h*w*512

# 原来的单层双向LSTM
(self.feed('rpn_conv/3x3').Bilstm(512, 128, 512, name='lstm_o'))
# bilstm之后输出的尺寸为(N, H, W, 512)

"""
和faster—rcnn相似,在ctpn的rpn网络中,使用双向lstm和全连接得到预测的
目标概率和回归框,在faster-rcnn中使用的是卷积的方式从basenet的最后一层生成
使用LSTM的输出来计算位置偏移和类别概率(判断是否是物体,不判断类别的种类)
输入尺寸为(N, H, W, 512) 输出尺寸(N, H, W, int(d_o))
可以将这一层当做目标检测中的最后一层feature_map
rpn_bbox_pred--对于h*w的尺寸上,每一anchor上生成4个位置偏移量
rpn_cls_score--对于h*w的尺寸上,每一anchor上生成2个置信度得分,判断是否为物体

"""
(self.feed('lstm_o').lstm_fc(512, len(anchor_scales) * 10 * 4, name='rpn_bbox_pred'))
(self.feed('lstm_o').lstm_fc(512, len(anchor_scales) * 10 * 2, name='rpn_cls_score'))

# generating training labels on the fly
# output: rpn_labels(HxWxA, 2) rpn_bbox_targets(HxWxA, 4) rpn_bbox_inside_weights rpn_bbox_outside_weights
# 给每个anchor上标签,并计算真值(也是delta的形式),以及内部权重和外部权重
(self.feed('rpn_cls_score', 'gt_boxes', 'gt_ishard', 'dontcare_areas', 'im_info')
.anchor_target_layer(_feat_stride, anchor_scales, name='rpn-data'))

# shape is (1, H, W, Ax2) -> (1, H, WxA, 2)
# 给之前得到的score进行softmax,得到0-1之间的得分
(self.feed('rpn_cls_score')
.spatial_reshape_layer(2, name='rpn_cls_score_reshape')
.spatial_softmax(name='rpn_cls_prob'))
'''
# the below is the rcnn net model from faster_rcnn
# 后面的部分是fasterrcnn之后的ROIPooling部分
(self.feed('rpn_cls_prob').spatial_reshape_layer(len(anchor_scales) * 10 * 2, name='rpn_cls_prob_reshape'))

self.feed('rpn_cls_prob_reshape', 'rpn_bbox_pred', 'im_info').proposal_layer(
_feat_stride, anchor_scales, 'TRAIN', name='rpn_rois')

(self.feed('rpn_rois', 'gt_boxes').proposal_target_layer(n_classes, name='roi-data'))

# ========= RCNN ============
(self.feed('conv5_3', 'roi-data').roi_pool(7, 7, 1.0/16, name='pool_5')
.fc(4096, name='fc6').dropout(0.5, name='drop6')
.fc(4096, name='fc7').dropout(0.5, name='drop7')
.fc(n_classes, relu=False, name='cls_score').softmax(name='cls_prob'))

(self.feed('drop7').fc(n_classes*4, relu=False, name='bbox_pred'))
'''

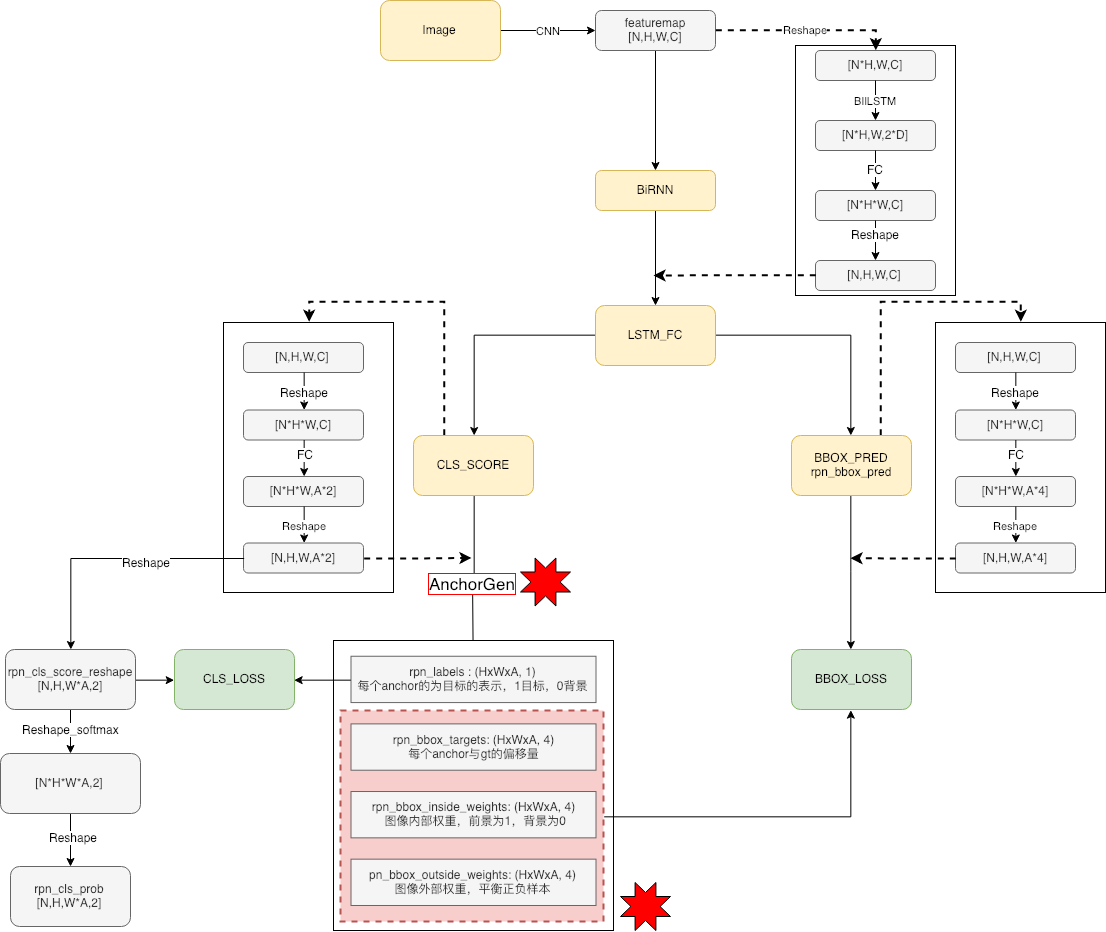
可以看到CTPN的网络结构有FasterRcnn改变而来,使用vggnet进行图像的特征提取,对得到的最后一层featuremap的尺寸为$[N,H,W,C]$,进行维度变换为$[NH,W,C]$成为序列,使用BLSTM得到的维度为$[NH,W,2D]$其中$D$为单向RNN的隐藏层节点数,转换维度为$[NHW,2D]$,使用全连接进行维度转换为$[NHW,C]$,最后再reshape成$[N,H,W,C]$,在这一步中,使用RNNCNN之后的特征图进行特征图长度方向上的连接;接下来使用lstm_fc函数对anchor进行目标类别预测和边界回归框预测,在这一层的特征图上,每个点生成A个anchor,每个anchor存在目标类别预测和边界回归预测:对于回归预测,每个格点生成2A个目标预测;对于边界回归预测,每个格点生成4A个边界预测。

网络模型结构如下所示

anchor生成及筛选

在整个模型中,AnchorGen处需要详细说明,这就是大名鼎鼎的RPN,下面结合代码说明:

1
2
3
4
5
6
7
8
9
10
11
12
13
14
15
16
17
18
19
20
21
22
23
24
25
26
27
28
29
30
31
32
33
34
35
36
37
38
39
40
41
42
43
44
45
46
47
48
49
50
51
52
53
54
55
56
57
58
59
60
61
62
63
64
65
66
67
68
69
70
71
72
73
74
75
76
77
78
79
80
81
82
83
84
85
86
87
88
89
90
91
92
93
94
95
96
97
98
99
100
101
102
103
104
105
106
107
108
109
110
111
112
113
114
115
116
117
118
119
120
121
122
123
124
125
126
127
128
129
130
131
132
133
134
135
136
137
138
139
140
141
142
143
144
145
146
147
148
149
150
151
152
153
154
155
156
157
158
159
160
161
162
163
164
165
166
167
168
169
170
171
172
173
174
175
176
177
178
179
180
181
182
183
184
185
186
187
188
189
190
191
192
193
194
195
196
197
198
199
200
201
202
203
204
205
206
207
208
209
210
211
212
213
214
215
216
217
218
219
220
221
222
223
224
225
226
227
228
229
230
231
232
233
234
235
236
237
238
239
240
241
242
243
244
245
246
247
248
249
250
251
252
253
254
255
256
257
258
259
260
261
262
263
264
265
266
267
268
269
270
271
272
273
274
275
276
277
278
279
280
281
282
283
284
285
286
287
288
289
290
291
292
293
294
295
296
297
298
299
300
301
302
303
304
305
306
307
308
309
310
311
312
313
314
315
316
317
318
319
320
321
322
323
324
325
326
327
328
329
330
331
332
333
334
335
336
# -*- coding:utf-8 -*-
import numpy as np
import numpy.random as npr

from ..fast_rcnn.config import cfg
from bbox import bbox_overlaps, bbox_intersections

DEBUG = False

# 生成基础anchor box
def generate_basic_anchors(sizes, base_size=16):
base_anchor = np.array([0, 0, base_size - 1, base_size - 1], np.int32)
anchors = np.zeros((len(sizes), 4), np.int32)
index = 0
for h, w in sizes:
anchors[index] = scale_anchor(base_anchor, h, w)
index += 1
return anchors

# 根据baseanchor和设定的anchor的高度和宽度进行设定的anchor生成
def scale_anchor(anchor, h, w):
x_ctr = (anchor[0] + anchor[2]) * 0.5
y_ctr = (anchor[1] + anchor[3]) * 0.5
scaled_anchor = anchor.copy()
scaled_anchor[0] = x_ctr - w / 2 # xmin
scaled_anchor[2] = x_ctr + w / 2 # xmax
scaled_anchor[1] = y_ctr - h / 2 # ymin
scaled_anchor[3] = y_ctr + h / 2 # ymax
return scaled_anchor

# 生成anchor box
# 此处使用的是宽度固定,高度不同的anchor设置
def generate_anchors(base_size=16, ratios=[0.5, 1, 2],
scales=2 ** np.arange(3, 6)):
heights = [11, 16, 23, 33, 48, 68, 97, 139, 198, 283]
widths = [16]
sizes = []
for h in heights:
for w in widths:
sizes.append((h, w))
return generate_basic_anchors(sizes)

# 生成的anchor和groundtruth之间进行转换,转换方式和论文一致
def bbox_transform(ex_rois, gt_rois):
"""
computes the distance from ground-truth boxes to the given boxes, normed by their size
:param ex_rois: n * 4 numpy array, anchor boxes
:param gt_rois: n * 4 numpy array, ground-truth boxes
:return: deltas: n * 4 numpy array, ground-truth boxes
"""
ex_widths = ex_rois[:, 2] - ex_rois[:, 0] + 1.0 # anchor width
ex_heights = ex_rois[:, 3] - ex_rois[:, 1] + 1.0 # anchor height
ex_ctr_x = ex_rois[:, 0] + 0.5 * ex_widths # anchor center x
ex_ctr_y = ex_rois[:, 1] + 0.5 * ex_heights # anchor center y

assert np.min(ex_widths) > 0.1 and np.min(ex_heights) > 0.1, \
'Invalid boxes found: {} {}'. \
format(ex_rois[np.argmin(ex_widths), :], ex_rois[np.argmin(ex_heights), :])

gt_widths = gt_rois[:, 2] - gt_rois[:, 0] + 1.0 # gt_box width
gt_heights = gt_rois[:, 3] - gt_rois[:, 1] + 1.0 # gt_box height
gt_ctr_x = gt_rois[:, 0] + 0.5 * gt_widths # gt_box center x
gt_ctr_y = gt_rois[:, 1] + 0.5 * gt_heights # gt_box center y

# warnings.catch_warnings()
# warnings.filterwarnings('error')
targets_dx = (gt_ctr_x - ex_ctr_x) / ex_widths # (gt_c_x-a_c_x)
targets_dy = (gt_ctr_y - ex_ctr_y) / ex_heights
targets_dw = np.log(gt_widths / ex_widths)
targets_dh = np.log(gt_heights / ex_heights)

targets = np.vstack(
(targets_dx, targets_dy, targets_dw, targets_dh)).transpose()

return targets

# 生成anchors
def anchor_target_layer(
rpn_cls_score, gt_boxes, gt_ishard, dontcare_areas, im_info, _feat_stride=[16, ],
anchor_scales=[16, ]):
"""
Assign anchors to ground-truth targets. Produces anchor classification
labels and bounding-box regression targets.
Parameters
----------
rpn_cls_score: (1, H, W, Ax2) bg/fg scores of previous conv layer
gt_boxes: (G, 5) vstack of [x1, y1, x2, y2, class]
gt_ishard: (G, 1), 1 or 0 indicates difficult or not
dontcare_areas: (D, 4), some areas may contains small objs but no labelling. D may be 0
im_info: a list of [image_height, image_width, scale_ratios]
_feat_stride: the downsampling ratio of feature map to the original input image
anchor_scales: the scales to the basic_anchor (basic anchor is [16, 16])
----------
Returns
----------
rpn_labels : (HxWxA, 1), for each anchor, 0 denotes bg, 1 fg, -1 dontcare
rpn_bbox_targets: (HxWxA, 4), distances of the anchors to the gt_boxes(may contains some transform)
that are the regression objectives
rpn_bbox_inside_weights: (HxWxA, 4) weights of each boxes, mainly accepts hyper param in cfg
rpn_bbox_outside_weights: (HxWxA, 4) used to balance the fg/bg,
beacuse the numbers of bgs and fgs mays significiantly different
"""
# anchors is the [x_min,y_min,x_max,y_max]
# 生成基本的anchor,一共10个
_anchors = generate_anchors(scales=np.array(anchor_scales))
_num_anchors = _anchors.shape[0] # 10个anchor

# allow boxes to sit over the edge by a small amount
_allowed_border = 0
# 原始图像的信息,图像的高宽及通道数
im_info = im_info[0]

# 在feature-map上定位anchor,并加上delta,得到在实际图像中anchor的真实坐标
"""
Algorithm:
for each (H, W) location i
generate 9 anchor boxes centered on cell i
apply predicted bbox deltas at cell i to each of the 9 anchors
filter out-of-image anchors
measure GT overlap
"""
assert rpn_cls_score.shape[0] == 1, \
'Only single item batches are supported'

# map of shape (..., H, W)
height, width = rpn_cls_score.shape[1:3] # feature-map的高宽
# 1. Generate proposals from bbox deltas and shifted anchors
shift_x = np.arange(0, width) * _feat_stride
shift_y = np.arange(0, height) * _feat_stride
shift_x, shift_y = np.meshgrid(shift_x, shift_y) # in W H order
# 生成feature-map和真实图像上anchor之间的偏移量
# shifts构建网格结构,shape [height*width,4]
shifts = np.vstack((shift_x.ravel(), shift_y.ravel(),
shift_x.ravel(), shift_y.ravel())).transpose()
A = _num_anchors # 10个anchor
K = shifts.shape[0] # feature-map的宽乘高的大小
# 为当前的featuremap每个点生成A个anchor,shape is [K,A,4]
all_anchors = (_anchors.reshape((1, A, 4)) +
shifts.reshape((1, K, 4)).transpose((1, 0, 2)))
all_anchors = all_anchors.reshape((K * A, 4)) # shape is (K*A,4)
# 在featuremap上每个点生成A个anchor
total_anchors = int(K * A)
# only keep anchors inside the image
# 因为生成的anchor尺寸有大有小,因此在边缘处生成的anchor有可能会超过原始图像的边界,
# 将这些超过边界的anchor去掉,得到的是这些anchor的在all_anchors中的索引
# 仅保留那些还在图像内部的anchor,超出图像的都删掉
# anchors[:]=[x_min,y_min,x_max,y_max]
inds_inside = np.where(
(all_anchors[:, 0] >= -_allowed_border) &
(all_anchors[:, 1] >= -_allowed_border) &
(all_anchors[:, 2] < im_info[1] + _allowed_border) & # width
(all_anchors[:, 3] < im_info[0] + _allowed_border) # height
)[0]

# keep only inside anchors
anchors = all_anchors[inds_inside, :] # 保留那些在图像内的anchor

# 至此,anchor准备好了
# --------------------------------------------------------------
# label: 1 is positive, 0 is negative, -1 is dont care
# (A)
labels = np.empty((len(inds_inside),), dtype=np.float32)
labels.fill(-1) # 初始化label,均为-1
# overlaps between the anchors and the gt boxes
# overlaps (ex, gt), shape is A x G
# 计算anchor和gt-box的overlap,用来给anchor上标签
# anchor box and groundtruth box 交集面积/并集面积
# 通过IOU的得分来确定anchor为正样本与否
# overlaps shape is [anchor.shape[0],gt_box.shape[0]]
overlaps = bbox_overlaps(
np.ascontiguousarray(anchors, dtype=np.float),
np.ascontiguousarray(gt_boxes, dtype=np.float))
# 存放每一个anchor和每一个gtbox之间的overlap
# 找到和每一个gtbox,overlap最大的那个anchor
argmax_overlaps = overlaps.argmax(axis=1)
max_overlaps = overlaps[np.arange(len(inds_inside)), argmax_overlaps]
# 找到每个位置上10个anchor中与gtbox,overlap最大的那个
gt_argmax_overlaps = overlaps.argmax(axis=0)
gt_max_overlaps = overlaps[gt_argmax_overlaps,
np.arange(overlaps.shape[1])]
gt_argmax_overlaps = np.where(overlaps == gt_max_overlaps)[0]

if not cfg.TRAIN.RPN_CLOBBER_POSITIVES:
# assign bg labels first so that positive labels can clobber them
# 先给背景上标签,小于0.3overlap的为负样本label为0
labels[max_overlaps < cfg.TRAIN.RPN_NEGATIVE_OVERLAP] = 0

# -----------------------------------#
# 正样本的确定,iou得分大于0.7和每个位置上具有最大IOU得分的anchor
# fg label: for each gt, anchor with highest overlap
# 每个位置上的10个个anchor中overlap最大的认为是前景
labels[gt_argmax_overlaps] = 1
# fg label: above threshold IOU
# overlap大于0.7的认为是前景
labels[max_overlaps >= cfg.TRAIN.RPN_POSITIVE_OVERLAP] = 1

if cfg.TRAIN.RPN_CLOBBER_POSITIVES:
# assign bg labels last so that negative labels can clobber positives
labels[max_overlaps < cfg.TRAIN.RPN_NEGATIVE_OVERLAP] = 0

# preclude dontcare areas
# 这里我们暂时不考虑有doncare_area的存在
if dontcare_areas is not None and dontcare_areas.shape[0] > 0:
# intersec shape is D x A
intersecs = bbox_intersections(
np.ascontiguousarray(dontcare_areas, dtype=np.float), # D x 4
np.ascontiguousarray(anchors, dtype=np.float) # A x 4
)
intersecs_ = intersecs.sum(axis=0) # A x 1
labels[intersecs_ > cfg.TRAIN.DONTCARE_AREA_INTERSECTION_HI] = -1

# 这里我们暂时不考虑难样本的问题
# preclude hard samples that are highly occlusioned, truncated or difficult to see
if cfg.TRAIN.PRECLUDE_HARD_SAMPLES and gt_ishard is not None and gt_ishard.shape[0] > 0:
assert gt_ishard.shape[0] == gt_boxes.shape[0]
gt_ishard = gt_ishard.astype(int)
gt_hardboxes = gt_boxes[gt_ishard == 1, :]
if gt_hardboxes.shape[0] > 0:
# H x A
hard_overlaps = bbox_overlaps(
np.ascontiguousarray(gt_hardboxes, dtype=np.float), # H x 4
np.ascontiguousarray(anchors, dtype=np.float)) # A x 4
hard_max_overlaps = hard_overlaps.max(axis=0) # (A)
labels[hard_max_overlaps >= cfg.TRAIN.RPN_POSITIVE_OVERLAP] = -1
max_intersec_label_inds = hard_overlaps.argmax(axis=1) # H x 1
labels[max_intersec_label_inds] = -1 #

# subsample positive labels if we have too many
# 对正样本进行采样,如果正样本的数量太多的话
# 限制正样本的数量不超过128个,排除的置位dont_Care类
# TODO 这个后期可能还需要修改,毕竟如果使用的是字符的片段,那个正样本的数量是很多的。
num_fg = int(cfg.TRAIN.RPN_FG_FRACTION * cfg.TRAIN.RPN_BATCHSIZE)
fg_inds = np.where(labels == 1)[0]
if len(fg_inds) > num_fg:
disable_inds = npr.choice(
fg_inds, size=(len(fg_inds) - num_fg), replace=False) # 随机去除掉一些正样本
labels[disable_inds] = -1 # 变为-1

# subsample negative labels if we have too many
# 对负样本进行采样,如果负样本的数量太多的话
# 正负样本总数是256,限制正样本数目最多128,
# 如果正样本数量小于128,差的那些就用负样本补上,凑齐256个样本
num_bg = cfg.TRAIN.RPN_BATCHSIZE - np.sum(labels == 1)
bg_inds = np.where(labels == 0)[0]
if len(bg_inds) > num_bg:
disable_inds = npr.choice(
bg_inds, size=(len(bg_inds) - num_bg), replace=False)
labels[disable_inds] = -1
# print "was %s inds, disabling %s, now %s inds" % (
# len(bg_inds), len(disable_inds), np.sum(labels == 0))

# 至此, 上好标签,开始计算rpn-box的真值
# --------------------------------------------------------------
bbox_targets = np.zeros((len(inds_inside), 4), dtype=np.float32)
# 根据anchor和gtbox计算得真值(anchor和gtbox之间的偏差)
bbox_targets = _compute_targets(anchors, gt_boxes[argmax_overlaps, :])
# 内部权重,前景就给1,其他是0
bbox_inside_weights = np.zeros((len(inds_inside), 4), dtype=np.float32)
bbox_inside_weights[labels == 1, :] = np.array(
cfg.TRAIN.RPN_BBOX_INSIDE_WEIGHTS)

bbox_outside_weights = np.zeros((len(inds_inside), 4), dtype=np.float32)
if cfg.TRAIN.RPN_POSITIVE_WEIGHT < 0:
# 此处使用uniform权重,也就是正样本是1,负样本是0
# uniform weighting of examples (given non-uniform sampling)
# num_examples = np.sum(labels >= 0) + 1
# positive_weights = np.ones((1, 4)) * 1.0 / num_examples
# negative_weights = np.ones((1, 4)) * 1.0 / num_examples
positive_weights = np.ones((1, 4)) # 前景为1
negative_weights = np.zeros((1, 4)) # 背景为0
else:
assert ((cfg.TRAIN.RPN_POSITIVE_WEIGHT > 0) &
(cfg.TRAIN.RPN_POSITIVE_WEIGHT < 1))
positive_weights = (cfg.TRAIN.RPN_POSITIVE_WEIGHT /
(np.sum(labels == 1)) + 1)
negative_weights = ((1.0 - cfg.TRAIN.RPN_POSITIVE_WEIGHT) /
(np.sum(labels == 0)) + 1)
# 外部权重,前景是1,背景是0
# bbox_outside_weights初始化为0,将label中为0的位置赋值bbox_outside_weights为0,labels为1的位置赋值为1
bbox_outside_weights[labels == 1, :] = positive_weights
bbox_outside_weights[labels == 0, :] = negative_weights

# map up to original set of anchors
# 一开始是将超出图像范围的anchor直接丢掉的,现在在加回来
# inds_inside 是原始anchor中的索引
labels = _unmap(labels, total_anchors, inds_inside, fill=-1) # 这些anchor的label是-1,也即dontcare
bbox_targets = _unmap(bbox_targets, total_anchors, inds_inside, fill=0) # 这些anchor的真值是0,也即没有值
bbox_inside_weights = _unmap(bbox_inside_weights, total_anchors,
inds_inside, fill=0) # 内部权重以0填充
bbox_outside_weights = _unmap(bbox_outside_weights, total_anchors,
inds_inside, fill=0) # 外部权重以0填充

# labels
labels = labels.reshape((1, height, width, A)) # reshap一下label
rpn_labels = labels

# bbox_targets
bbox_targets = bbox_targets.reshape((1, height, width, A * 4)) # reshape
rpn_bbox_targets = bbox_targets

# bbox_inside_weights
bbox_inside_weights = bbox_inside_weights.reshape((1, height, width, A * 4))
rpn_bbox_inside_weights = bbox_inside_weights

# bbox_outside_weights
bbox_outside_weights = bbox_outside_weights.reshape((1, height, width, A * 4))
rpn_bbox_outside_weights = bbox_outside_weights

rpn_data=(rpn_labels, rpn_bbox_targets, rpn_bbox_inside_weights, rpn_bbox_outside_weights)

return rpn_data

# 将排除掉边界之外的anchors之后的anchor补全回来
def _unmap(data, count, inds, fill=0):
""" Unmap a subset of item (data) back to the original set of items (of
size count) """
if len(data.shape) == 1:
ret = np.empty((count,), dtype=np.float32)
ret.fill(fill)
ret[inds] = data
else:
ret = np.empty((count,) + data.shape[1:], dtype=np.float32)
ret.fill(fill)
ret[inds, :] = data
return ret

# 计算anchor和gt之间的矩形框的偏差
def _compute_targets(ex_rois, gt_rois):
"""Compute bounding-box regression targets for an image."""

assert ex_rois.shape[0] == gt_rois.shape[0]
assert ex_rois.shape[1] == 4
assert gt_rois.shape[1] == 5

return bbox_transform(ex_rois, gt_rois[:, :4]).astype(np.float32, copy=False)

对于bbox使用cpython写成(.pyx文件)

1
2
3
4
5
6
7
8
9
10
11
12
13
14
15
16
17
18
19
20
21
22
23
24
25
26
27
28
29
30
31
32
33
34
35
36
37
38
39
40
41
42
43
44
45
46
47
48
49
50
51
52
53
54
55
56
57
58
59
60
61
62
63
64
65
66
67
68
69
70
71
72
73
74
75
76
77
78
79
80
81
82
83
84
85
86
87
88
89
90
91
92
93
94
95
96
97
import numpy as np
cimport numpy as np


DTYPE = np.float
ctypedef np.float_t DTYPE_t

# 计算IOU
def bbox_overlaps(
np.ndarray[DTYPE_t, ndim=2] boxes,
np.ndarray[DTYPE_t, ndim=2] query_boxes):
"""
Parameters
----------
boxes: (N, 4) ndarray of float, anchor box nums
query_boxes: (K, 4) ndarray of float, groud_truth object nums,[x_min,y_min,x_max,y_max,class]
Returns
-------
overlaps: (N, K) ndarray of overlap between boxes and query_boxes
"""
cdef unsigned int N = boxes.shape[0]
cdef unsigned int K = query_boxes.shape[0]
cdef np.ndarray[DTYPE_t, ndim=2] overlaps = np.zeros((N, K), dtype=DTYPE)
cdef DTYPE_t iw, ih, box_area
cdef DTYPE_t ua
cdef unsigned int k, n
for k in range(K):
box_area = (
(query_boxes[k, 2] - query_boxes[k, 0] + 1) *
(query_boxes[k, 3] - query_boxes[k, 1] + 1)
)
for n in range(N):
# 水平方向上的交集,如果存在那么iw为正
iw = (
min(boxes[n, 2], query_boxes[k, 2]) -
max(boxes[n, 0], query_boxes[k, 0]) + 1
)
if iw > 0:
# 竖直方向上的交集
ih = (
min(boxes[n, 3], query_boxes[k, 3]) -
max(boxes[n, 1], query_boxes[k, 1]) + 1
)
if ih > 0:
# 如果存在交集,计算并集的面积
# union area
ua = float(
(boxes[n, 2] - boxes[n, 0] + 1) *
(boxes[n, 3] - boxes[n, 1] + 1) +
box_area - iw * ih
)
# 交集面积/并集面积
overlaps[n, k] = iw * ih / ua
return overlaps


# anchor与gt交集面积相对于gt面积的比例
def bbox_intersections(
np.ndarray[DTYPE_t, ndim=2] boxes,
np.ndarray[DTYPE_t, ndim=2] query_boxes):
"""
For each query box compute the intersection ratio covered by boxes
----------
Parameters
----------
boxes: (N, 4) ndarray of float
query_boxes: (K, 4) ndarray of float
Returns
-------
overlaps: (N, K) ndarray of intersec between boxes and query_boxes
"""
cdef unsigned int N = boxes.shape[0]
cdef unsigned int K = query_boxes.shape[0]
cdef np.ndarray[DTYPE_t, ndim=2] intersec = np.zeros((N, K), dtype=DTYPE)
cdef DTYPE_t iw, ih, box_area
cdef DTYPE_t ua
cdef unsigned int k, n
for k in range(K):
box_area = (
(query_boxes[k, 2] - query_boxes[k, 0] + 1) *
(query_boxes[k, 3] - query_boxes[k, 1] + 1)
)
for n in range(N):
iw = (
min(boxes[n, 2], query_boxes[k, 2]) -
max(boxes[n, 0], query_boxes[k, 0]) + 1
)
if iw > 0:
ih = (
min(boxes[n, 3], query_boxes[k, 3]) -
max(boxes[n, 1], query_boxes[k, 1]) + 1
)
if ih > 0:
intersec[n, k] = iw * ih / box_area
return intersec

代码中的注释已经写得明明白白了。anchor生成函数为anchor_target_layer.py

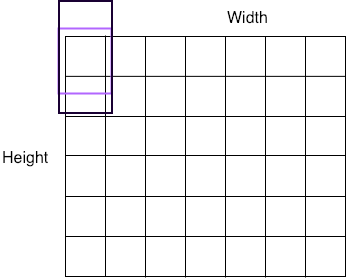
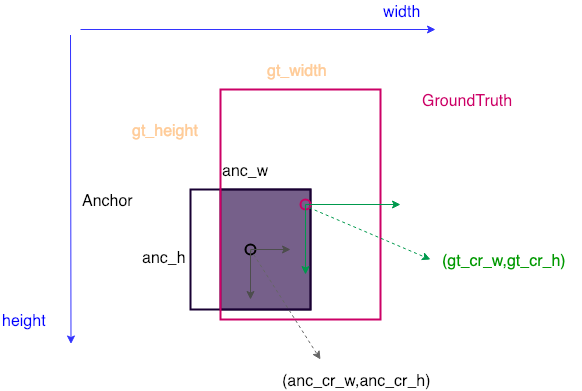
首先根据设定的anchor高度和宽度在特征图上每个cell生成A个anchors,这些anchors有的会超过原始图像的边界,如上图所示,将这些超出边界的anchors先删除,并记录保留的anchor在原始所有anchors中的索引值,使用内部的anchor和groundtruth进行IOU计算(anchor和gt之间如果存在交集,则使用交集面积和二者并集的面积进行IOU计算),使用两个原则进行anchor正样本的认定:如果anchor和gt之间的IOU大于设定的阈值0.7则认定该anchor为正样本;将具有和任意gt最大的IOU的anchor为正样本,也就是和gt最大的几个anchor最为正样本,这一步选择的anchor数量和gt的数量相同。至此就确定了正样本的anchor和剩余的负样本anchor,使用设定的正负样本数量,来控制正负样本的数量,将正负样本和和gt之间计算偏移量并作为目标框的label。对于anchor和gt之间的偏移量计算如下图所示

图中红色表示groundtruth,黑色表示anchor box,首先计算两个矩形框的中心坐标和宽度高度,计算公式为
$$
\begin{align}
target_{x} &=(GT_x-AN_x)/AN_{width} \
traget_y &=(GT_y-an_y)/AN_{height} \
traget_w &= \log (GT_{width}/AN_{width}) \
traget_h &= \log (GT_{height}/AN_{height})
\end{align}
$$
整个流程如下图所示

总结

至此,对CTPN网络结构结合代码进行了一些跟人理解的解读,该模型与2016年提出,可以看到收到很多的fastercnn的影响,可以看到CTPN具有如下的一些特点

  • 基础VGG网络的使用,因此一般需要ImageNet数据集的预训练权重会使得训练更快速和平稳
  • Bilstm的使用使得模型无法向CNN那样并行运算,影响了模型的速度
  • Anchor的设定为等宽度变高度,因此这种anchor只能适用于水平方向文本的检测,也可以通过更改anchor使得anchor兼容竖直方向的文本检测
  • 模型中anchor的宽度为15,因此模型的检测粒度收到该设置的影响,有可能存在边界不明确的状况
  • 因为使用的是和fasterrcnn相同的anchor生成及预测方法,因此在inference阶段需要对预测的值进行反向变换得到目标框

EAST

论文关键idea

  • 提出了两段式的文本检测方法,FCN+NMS,消除多过程造成的中间误差累计,减少了检测时间
  • 模型可以进行单词级别检测,又可以进行文本行检测,检测的形状可以是任意形状的四边形也可以是普通的四边形
  • 采用了Locality-Aware NMS的预测框过滤

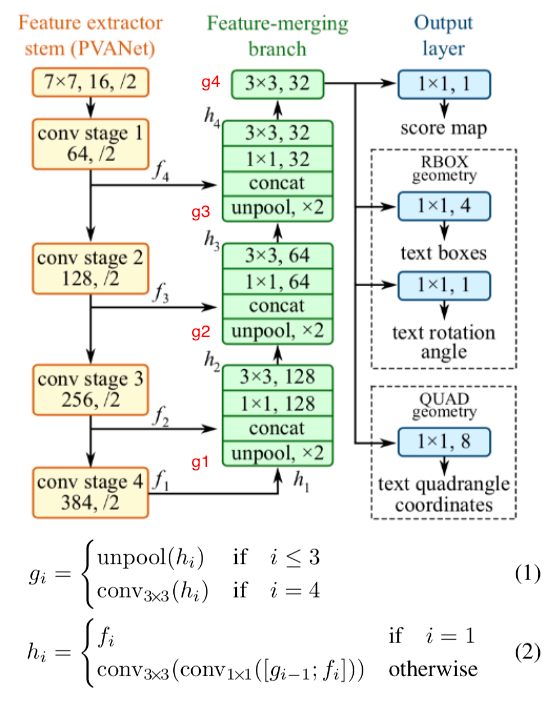
网络结构如下所示


Pipeline

  • 先用一个通用的网络(论文中采用的是PVAnet,实际在使用的时候可以采用VGG16,Resnet等)作为base net ,用于特征提取

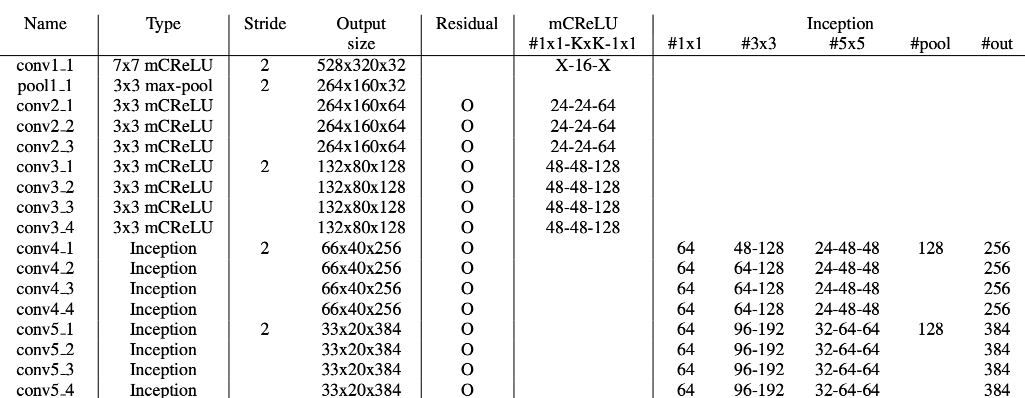
    此处对PAVnet进行一些说明,PAVnet主要是对VGG进行了改进并应用于目标检测任务,主要针对FasterRcnn的基础网络进行了改进,包含mCReLU,Inception,Hyper-feature各个结构

    在论文总的基础网络用的是PVAnet的基础网络,具体参数如下所示

    对于mCReLU结构和Inception结构如下所示

  • 基于上述主干特征提取网络,抽取不同层的featuremap(它们的尺寸分别是inuput-image的$\frac{1}{32},\frac{1}{16},\frac{1}{8},\frac{1}{4}$,这样可以得到不同尺度的特征图,这样做的目的是解决文本行尺度变换剧烈的问题,ealy-stage可用于预测小的文本行(较大的特征图),late-stage可用于预测大的文本行(较小的特征图)。

  • 特征合并层,将抽取的特征进行merge.这里合并的规则采用了Unet的方法,合并规则:从特征提取网络的顶部特征按照相应的规则向上进行合并,不断增大featuremap的尺寸。

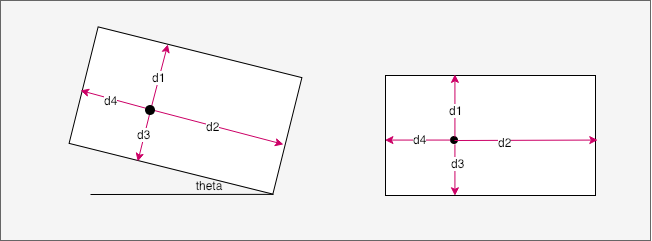
  • 网络输出层,包含文本得分和文本形状.根据不同文本形状(可分为RBOX和QUAD,对于RROX预测的是当前点距离gtbox的四个边的距离以及gtbox的相对图像的x正方向的角度$\theta$,也就是总共为5个值分别对应着$(d_1,d_2,d_3,d_4,\theta)$,而对于QUAD来说预测对应的gtbox的四个交点的坐标,一共8个值),对于RBOX对应的示意图如下所示

    图中的$d_{i}$对应的是当前点到gt的距离,知道了一个固定点到矩形的四条边的距离,就可以的知道这个矩形所在的位置和大小,即确定这个矩形。

    可以看出,对于RBOX输出5个预测值,而QUAD输出8个预测值。

对于层g和h的计算方式如图中公式所示。

  • 对于g为uppooling层,每次操作将featuremap放大到原来的2倍,主要进行特征图的上采样,论文中采取的双线性插值的方法进行上采样,没有使用反卷积的方式,减少了模型的计算量但是有可能降低模型的表达能力
  • 上采样之后的featuremap和下采样同样尺寸的f层进行merge并使用conv1x1降低合并后的模型的通道数
  • 之后使用conv3x3卷积,输出该阶段的featuremap
  • 上述操作重复3次最终模型输出的通道数为32

进行特征图合并之后进行预测输出,也就是针对不同的box形式输出5个或者8个预测值。

Loss计算

总的损失包含分类损失和回归损失,即
$$
L=L_S+\lambda_gL_g
$$
分类损失论文中使用的是平衡交叉熵损失
$$
\begin{align}
L_S&=\ {balanced-xent}(\dot Y,Y)\
&=-\beta Y \log \dot Y -(1-\beta)(1-\dot Y)(\log (1-\dot Y)) \
\
& where ::::: \beta=1-\frac{\sum_{ y \in Y}y }{|Y|}

\end{align}
$$
其中$\dot Y$为预测值,$Y$为label值。相比普通的交叉熵损失,平衡交叉熵损失对正负样本进行了平衡。

对于$L_g$损失,由于在对于RBOX信息中包含的是5个预测值即$(d_1,d_2,d_3,d_4,\theta)$,那么就可以得到损失为
$$
\begin{align}
& L_g=L_{AABB}+\lambda_{\theta}L_{\theta} \
where ::::::& L_{AABB}=-\log IoU (\dot R,R^*)=-\log \frac{|\dot R \cap R^* |}{|\dot R \cup R^*|} \
& L_{\theta}=1-\cos (\dot {\theta}-\theta^*)
\end{align}
$$
对于IOU损失的计算是,论文中对交集区域面积的计算方式为
$$
\begin{align}
&w_i=\min(\dot d_2,d_2^*)+\min(\dot d_4,d_4^*) \
&h_i=\min(\dot d_1,d_1^*)+\min(\dot d_3,d_3^*)
\end{align}
$$
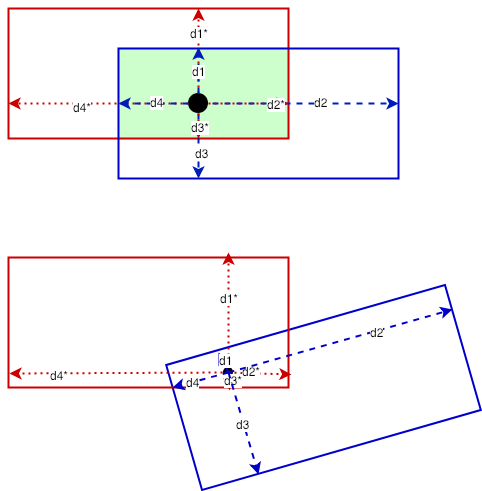
实际上这种计算方式是存在问题的,分析如下

如上图所示,红色对应gt,蓝色对应predict,如果不考虑角度,那么按照公式所述是正确的,但是考虑角度信息之后就会发现iou的交集面积计算公式存在错误。

Reference

-

赏杯咖啡!